
October 2026 market update
More inventory, more room to negotiate, and the slowest September for closings since 2008
Rates finally picked a direction in September, and it was not the one buyers wanted. Here is what that did to the Greater Denver Metro market, and what it sets up for the fourth quarter.
Published October 4, 2026 · September 2026 data · every figure checked against the source report
Greater Denver Metro · September 2026
Greater Denver Metro
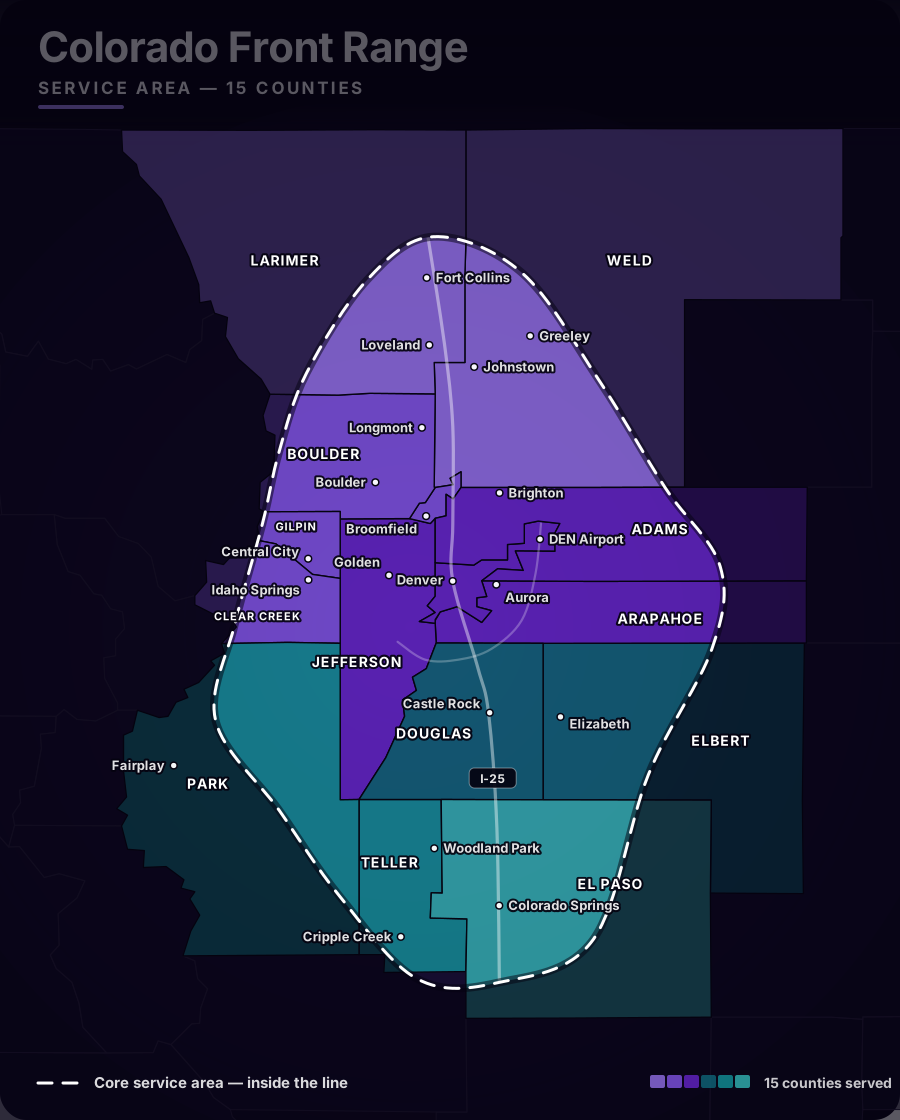
Adams, Arapahoe, Boulder, Broomfield, Clear Creek, Denver, Douglas, Elbert, Gilpin, Jefferson, Park counties. Statistics published by the Denver Metro Association of REALTORS from REcolorado data.
September closings came in at 2,849, down 11.71 percent from August and 21.39 percent from a year ago. That is the fewest September closings on record going back to 2008. The important caveat is timing: most homes that closed in September went under contract in August, when the 30-year fixed was near 6.7 percent. Through September it climbed every week and finished the month around 7.5 percent, and mid-month the Federal Reserve raised the federal funds rate for the first time since July 2023.
So September’s closings are a picture of August. Pending sales, at 2,908 and down 6.07 percent, are the first real read on the rate move, and that is a measured pullback rather than a retreat. The fuller effect lands in October and November closings.
Closed sales
2,849
fewest September closings on record dating back to 2008
▼-11.71%vs Aug▼-21.39%vs Sept 2025
Active listings
13,567
at month end
Median days in the MLS
32
Down from 35 days a year ago
▼3 days fasteryear over year
Months of inventory
4.76
All homes. Condos and townhomes sit at 7.21
Pending sales
2,908
The first read on September rate moves
▼-6.07%vs Aug
Close price to list price
98.45%
Up from 98.32% last September
▲+0.13 ptyear over year
For buyers, the arithmetic has improved. Inventory finished the month at 13,567 active listings and 4.76 months of supply. Condos and townhomes offer the most leverage of all: 7.21 months of inventory and a median close price of $365,500, down 6.28 percent year over year. If you are buying in that segment, price it with HOA dues and insurance in the same breath as the mortgage.
Source: DMAR. July and August as published in the August 2026 report; September as published in the September 2026 report.
View the data
| Month | Median days in the MLS | As published in |
|---|---|---|
| July 2026 | 21 | August 2026 report |
| Aug 2026 | 27 | August 2026 report |
| Sept 2026 | 32 | September 2026 report |
| Sept 2025 (reference) | 35 | September 2026 report |
Source: DMAR September 2026. A detached-only figure was not published, so it is not shown.
View the data
| Segment | Months of inventory |
|---|---|
| All homes | 4.76 |
| Condos and townhomes | 7.21 |
Since 2023, year-to-date closings have stayed within roughly six percent of one another and the overall median price within about three percent. The year-to-date median close price for detached homes is $650,000, matching each of the past two years. Year-to-date closings trail 2025 by 4.96 percent, a gap that has widened since August.
As October begins, the fourth quarter tends to reward buyers who keep moving while others wait for a fresh start after the New Year. Active listings typically taper through the fourth quarter, and some sellers will pull their homes for the holidays. Buyers who remain in the market will face less competition than at any other time of year.
Amanda Snitker, Chair of the DMAR Market Trends Committee and Metro Denver RealtorThe $1 million and above segment
The top of the market is not waiting for conditions to improve
Denver Metro, properties sold at $1 million or more.
While overall year-to-date sales are down 4.96 percent, the $1 million-plus segment is up 1.99 percent with 4,449 closed sales so far this year. Volume in the segment is up 3.17 percent to $7.30 billion, barely shy of its 2022 peak. New listings jumped 12.15 percent month over month, which reads as seller confidence, and buyers are not lingering: a median of 21 days in the MLS against 32 for the broader market, and 19 days for detached homes.
Source: DMAR September 2026.
View the data
| Segment | Year-to-date closed sales vs 2025 |
|---|---|
| All homes | -4.96% |
| $1M and above | +1.99% |
Source: DMAR September 2026.
View the data
| Segment | Median days in the MLS |
|---|---|
| Whole market | 32 |
| $1M and above, all | 21 |
| $1M and above, detached | 19 |
| $1M and above, attached | 23 |
Source: DMAR September 2026.
View the data
| Price band | Year-to-date closed sales growth |
|---|---|
| $1M to $1.5M | +5.60% |
| $1.5M to $2M | +5.41% |
| $2M and above | +11.11% |
| All $1M and above attached | +6.35% |
When you have room to maneuver, you can make a move, and right now Denver’s $1 million-plus market has plenty of it.
Michelle Schwinghammer, DMAR Market Trends Committee member and Metro Denver RealtorSeptember’s highest-priced detached sale was 31 Albion Place, Castle Rock, more than 10,000 square feet, at $7,400,000 after 44 days, in cash. The highest attached sale was 500 Adams Street, Cherry Creek North at $4,300,000, also cash.
Pricing and negotiation
What the close-to-list ratio is telling us
At 98.45 percent, the close-price-to-list-price ratio is actually a touch firmer than last September’s 98.32 percent. Sellers are not capitulating on price. What they are doing instead is paying for the gap in other currency, and with rates in the sevens that is where the negotiation has moved: rate buydowns, seller-paid concessions and adjustable-rate structures are all live at the table right now.
September 2025September 2026
Source: DMAR September 2026.
View the data
| Period | Close price to list price |
|---|---|
| September 2025 | 98.32% |
| September 2026 | 98.45% |
Updating soon
Colorado Springs and El Paso County
September figures for Colorado Springs and El Paso County are being verified against the source report and will be posted here by October 13. The numbers are published, but we check every figure against the original before it goes on this page, and we would rather leave a gap than print something unverified.
Expected on this page: October 13, 2026.
Updating soon
Boulder, Larimer and Weld counties
September figures for the northern Front Range are not published yet. The Colorado Association of REALTORS releases county-level September data on October 12. We would rather leave a gap than print an estimate.
Expected on this page: October 12, 2026.
What this means for you
Heading into the fourth quarter
If you are buying
- You have 13,567 active listings and 4.76 months of supply to work with, and competition thins out through the holidays.
- Condos and townhomes are where the leverage is: 7.21 months of inventory and a median of $365,500.
- Ask about structure, not just price. Rate buydowns and seller-paid concessions are the live negotiation right now.
- Underwrite the attached segment with HOA dues and insurance included, not bolted on afterward.
If you are selling
- Homes are taking 32 days at the median, up from 21 in July. Price to today, not to July.
- The close-to-list ratio held at 98.45 percent, so a well-priced home still gets close to asking.
- Build buydowns and concessions into the pricing strategy up front. Snitker’s point is that those sellers find a ready audience.
- Above $1 million the picture is different again: new listings up 12.15 percent and a 21-day median.
Want to know what this means for your address?
Metro-wide numbers set the backdrop. What your home is worth, or what you can buy, comes down to your street, your price band and your timing. Grab a slot and we will walk through it.
Book a free strategy callSources and method
Where these numbers come from
- Greater Denver Metro: DMAR Real Estate Market Trends Report, September 2026, published October 3, 2026. Statistics sourced from REcolorado. The July and August median-days-in-MLS points charted above are as published in the August 2026 report.
- Colorado Springs and El Paso County: PPAR and elevate MLS Listing and Sales Summary.
- Boulder, Larimer and Weld counties: Colorado Association of REALTORS county market reports, released on the 12th of each month.
Every figure on this page is read off the published source report and checked before it goes up. Where a region’s data is not out yet, or is still being verified, we say so and name the date rather than printing an estimate. We do not build back-series by working backwards from percentage changes. Months of inventory for the detached segment, the overall September median close price and the overall new-listings count were not published by DMAR this month, so they do not appear here.
Mike Rush · Your Colorado Real Estate Guide